Winkler AM, Webster MA, Brooks JC, Tracey I, Smith SM, Nichols TE.
| Tippett | Fisher | |||
|---|---|---|---|---|
| Set 1 | Histograms | Bland–Altman | Histograms | Bland–Altman |
| Set 2 | Histograms | Bland–Altman | Histograms | Bland–Altman |
| Set 3 | Histograms | Bland–Altman | Histograms | Bland–Altman |
| Set 4 | Histograms | Bland–Altman | Histograms | Bland–Altman |
| Error distribution |
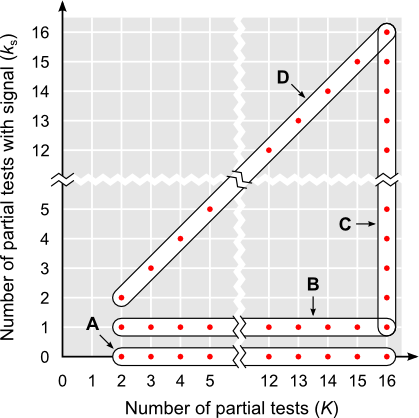
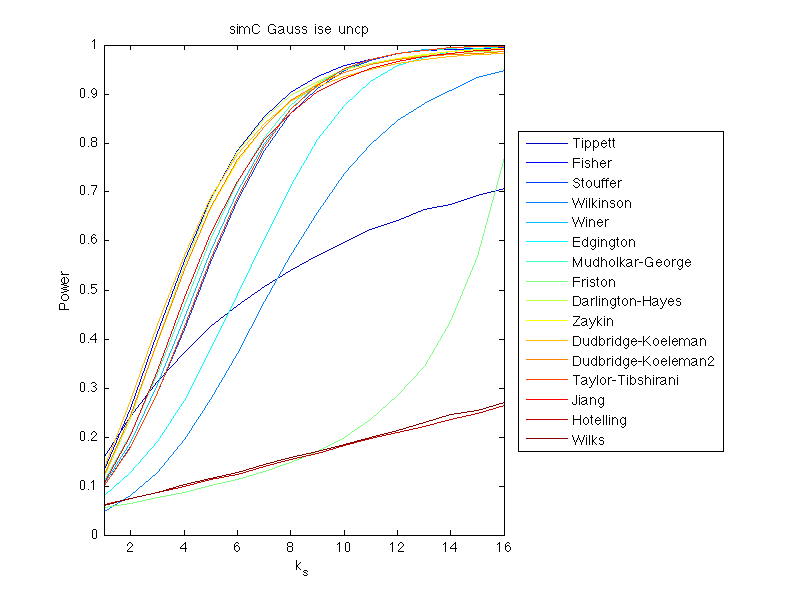
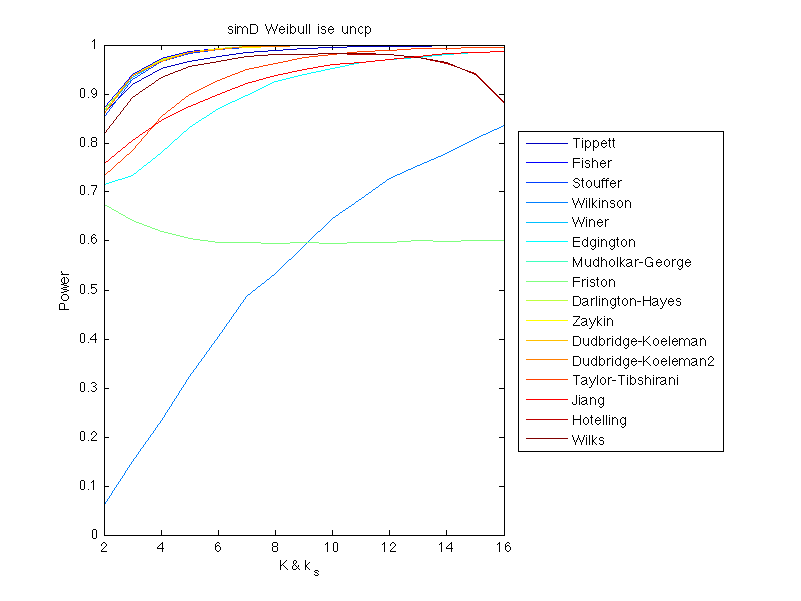
Simulations A | Simulations B | Simulations C | Simulations D | ||||||||
|---|---|---|---|---|---|---|---|---|---|---|---|---|
| Gauss | EE | ISE | EE+ISE | EE | ISE | EE+ISE | EE | ISE | EE+ISE | EE | ISE | EE+ISE |
| Weibull | EE | ISE | EE+ISE | EE | ISE | EE+ISE | EE | ISE | EE+ISE | EE | ISE | EE+ISE |
Line plots with just the first bars of each histograms:
| Error distribution | Simulations A | Simulations B | Simulations C | Simulations D | |
|---|---|---|---|---|---|
| Gauss | EE |  |
 |
 |
 |
| ISE |  |
 |
 |
 |
|
| EE+ISE |  |
 |
 |
 |
|
| Weibull | EE |  |
 |
 |
 |
| ISE | 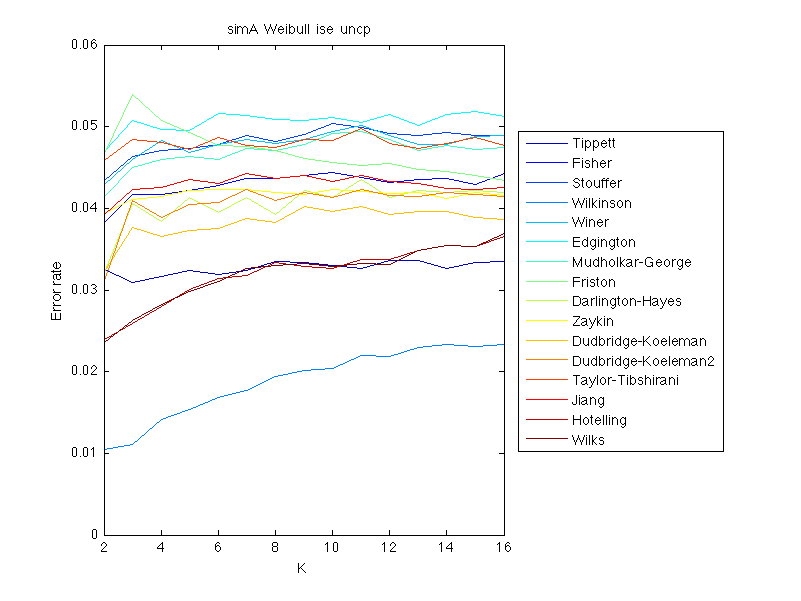 |
 |
 |
 |
|
| EE+ISE |  |
 |
 |
 |
Click here for the unified algorithm.